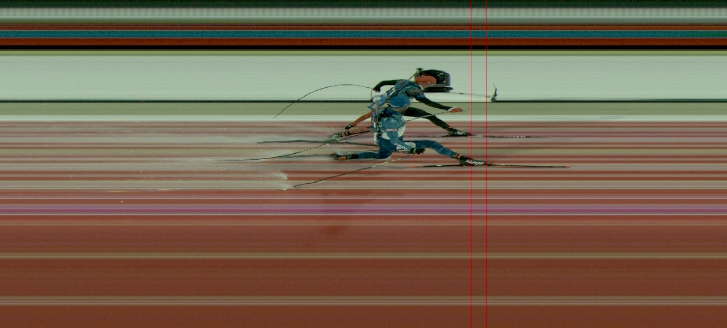

In the men's 15-kilometer mass start biathlon event at the 2018 Winter Olympic Games in PyeongChang, South Korea,
the clock was measuring time to the hundredth of a second. After over 35 minutes of racing, it could not distinguish between the top two finishers.
Officials turned to the photo-finish image above to determine the winner — by the length of a toe.
Olympic Games and World Championships showcase the world’s elite athletes. Although gold medalists can parlay their victories into large financial premiums, the winning margins are often vanishingly small. To surmount these margins, athletes continuously acquire sources of edge, from training methods to nutrition and equipment, and, in some cases, illicit performance-enhancing substances.
The trio of interactive visualizations below explores three stories from and beyond the edge of victory. First, situated in the 2018 Winter Olympic Games, you are invited to test hypothetical scenarios in which athletes' performances improve by small increments, from 0.05% to 1%. The second visualization highlights a story from the swimming pool, where advances in swimsuit design effectively changed the parameters of a sport. Finally, re-live the 2018 Winter Olympic Games men's singles luge event via an animation displaying the top eight athletes head-to-head.

For many elite athletes, qualifying for the Olympics is the principal (and admirable) goal of their athletic careers. Indeed, the vast majority of Olympians who participated in the 2018 Winter Olympic Games did not win a medal. However, a fraction of athletes measure success by Olympic medals won. What are the differences in athletic abilities between medal winners and non-medalists or between gold medalists and silver medalists? What would it take to win a medal?
This interactive visualization highlights how thin the margins of victory were in timed races at the 2018 Winter Olympic Games. Select your favorite sport to view the actual results of the top eight finishers, then test hypothetical scenarios in which subsets of these athletes are marginally faster. Improvements as small as 0.1% would have altered the medal standings of many events.

In 2009, the swimsuit brand Arena unveiled a pure-polyurethane competitive suit that was fully impermeable and
substantially reduced hydrodynamic drag. At the World Championships that year, athletes wearing pure-polyurethane suits set
an astonishing 37 world records.
The ensuing outcry spurred the Fédération Internationale de Natation (FINA), the governing body of elite swimming, to issue
new rules for swimsuit design in 2010. Specifically, full-body suits were no longer permitted and materials were only to be
textile fabrics that met specific guidelines on buoyancy and permeability.
This visualization of sprint races at World Championships between 2003 and 2017 shows the pure-polyurethane suits of
2009 to be outliers. In all 16 events analyzed, swim times progressed gradually between 2003 and 2007, then improved considerably
in 2009. After full-body suits and non-textile materials were banned, swim times slowed in 2011. A
2012 study
reported that the pure-polyurthane suits increased performance by up to 5.5%.

Luge is a winter sliding sport in which one athlete, or a two-person team of athletes,
lies face up on a racing sled and steers it at high speed down an artificial ice track.
At the 2018 Winter Olympic Games in PyeongChang, athletes in the men's singles competition completed four runs of the course. The
aggregate time of the four runs was measured to the thousandth of a second. With forty athletes competing in succession and
47–50 seconds per run, there were about two hours of competition.
To gauge provisional standings throughout the race,
times were recorded at several positions along the track. Based on these 'split times,' viewers watching the
competition could assess the athletes' performances and get a sense of the provisional standings during each run.
For example, a steering error would show up in a subsequent split-time comparison.
This animation incorporates actual split times, finishing times, and recorded speeds to model the
competition — as a head-to-head race between the top eight lugers and in less than one minute. Data are from the International Olympic Committee (IOC) and course information
is from the Fédération Internationale de Luge de Course (FIL).

The methodology and data sources for these visualizations, which were originally published as an academic thesis, are described
here.
Julian H. Lange (@julianhlange) uses analytical approaches and
graphics to bring out stories buried within data. He has a Master's degree from Parsons School of Design and a Ph.D. from Massachusetts Institute
of Technology. Visit julianhlange.com for a portfolio of his data visualization and science.
© 2018 Julian H. Lange